 The Buckinghamshire Grammar Schools (TBGS) have commissioned research to investigate the performance of different groups of children in the Secondary Transfer Tests (STT) for entry to Buckinghamshire grammar schools in 2019 and 2020. The reason for this is not clear, but one possibility is that it’s an attempt to demonstrate the test was fair following the serious failure of the 2019 test in which several of the questions were unanswerable. It is unsurprising that TBGS (marking their own homework!) conclude that their 11-plus is ‘functioning closely in line with national KS2 assessments’ and that there’s no need to adjust the exam.
The report focuses on the relationship between 11-plus scores and the demographic factors of gender, FSM, EAL, IDACI, ethnicity and SEN for both the 2019 and 2020 cohorts. The relationship between KS1 and KS2 attainment and 11-plus performance was also analysed for 2019. The study only looks at Bucks state school pupils and not privately educated or out of county pupils.
This report is interesting because it gives us detailed information about:
- 11-plus pass rates by socio-economic status
- 11-plus pass rates by gender and ethnicity
- 11-plus entrance rate by Special Education Need (SEN) status
- 11-plus entrance rate by socio-economic status
We’ll share the findings on each point below.
11-plus pass rates by socio-economic status
The report highlights a fact that has been proven again and again by research, wealthier pupils are more likely to pass the 11-plus.
The report looks at the test scores of Bucks pupils based on the Income Deprivation Affecting Children Index (IDACI) decile of pupils sitting the test. IDACI measures the proportion of all children aged 0 to 15 living in income deprived families in different local areas. Areas are ranked according to their levels of deprivation relative to that of other areas.
The report says, ‘There is an association between 11-plus performance and IDACI decile, the higher the decile (i.e. the more affluent), the higher the mean score.’
The following chart shows this in a simple way. 11-plus scores clearly increase based on how wealthy the pupil’s home area is.
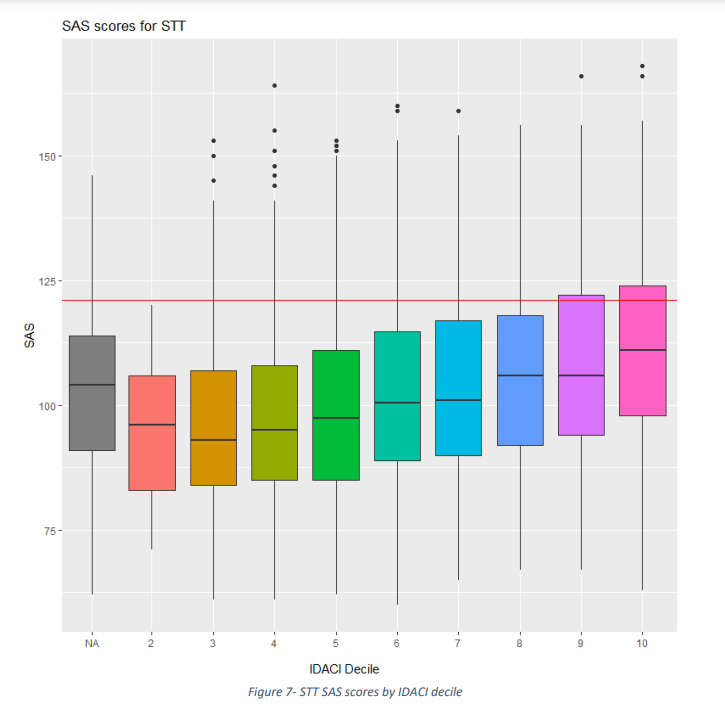
Secondary Transfer Test (11-plus) scores by the wealth of pupil’s home area
11-plus pass rates by gender and ethnicity
The Bucks grammars used their data to produce odds for different pupil groups passing their test. As an example the report states, ‘the estimated odds ratio for Chinese pupils in the 11-plus states that after controlling for all other variables, Chinese pupils are just over 4.8 times more likely to pass than reference group pupils.’
It is interesting that they chose to highlight positive odds for Chinese pupils. Of course some pupil groups have very poor odds of passing the Bucks test. This chart shows how much less likely a Free School Meals pupil is to pass than any typical pupil. The chart also shows that Pakistani pupils, Black Caribbean pupils and children with SEN support also have less chance of passing.
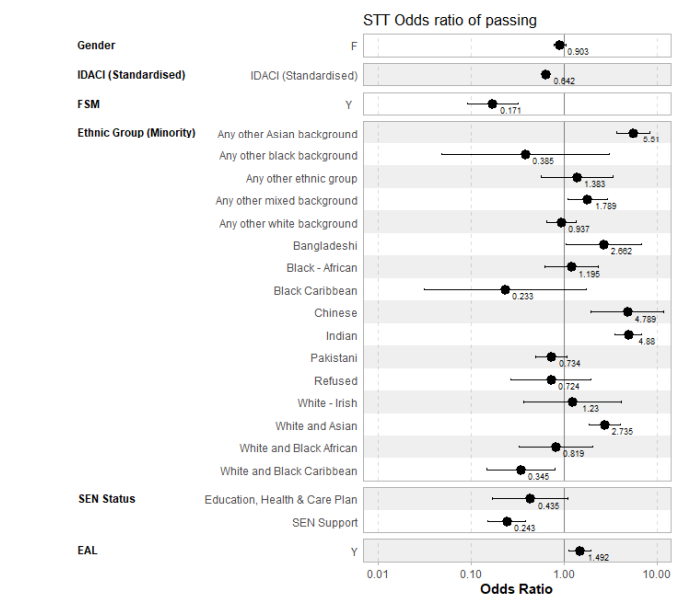
A roll of the ‘grammar school dice’ gives some pupils worse odds than others
It is quite something to see a grammar school test provider so openly revealing which pupil groups are doing badly in their test. Of course, this study was not designed to help those pupils groups in any way, or to speculate as to why the ‘roll of the 11-plus dice’ means some pupil groups are unluckier than others.
11-plus entrance rate by Special Education Need (SEN) status
This study is particularly interesting because Bucks is a county where every primary school pupil is automatically entered for the county’s 11-plus. The data shows which groups of pupils are most likely to actively withdraw from the test.
The report says, ‘entrants were typically those one would expect to participate in the assessment and suggests schools are having success in persuading parents to be realistic about their child’s chances of passing.’
So what does this ‘realism’ around passing the test mean? It’s clear that pupils receiving Free School Meals are significantly less likely to attempt the 11-plus compared to non-FSM pupils. Around 19% of FSM pupils do not attempt the 11-plus test, compared to 12% of non-FSM pupils.
Many SEN pupils do not take the test, with 43% withdrawing from the Bucks’ 11-plus process. It is perhaps not surprising that pupils with severe learning disabilities choose not take the test, however we can see that 38.5% of pupils with physical disabilities also choose not to sit the Bucks 11-plus.
We regularly hear from parents of dyslexic pupils that their sons and daughters are disadvantaged by 11-plus tests and a grammar school system. Possibly dyslexia is hidden under ‘other’ in these categories?
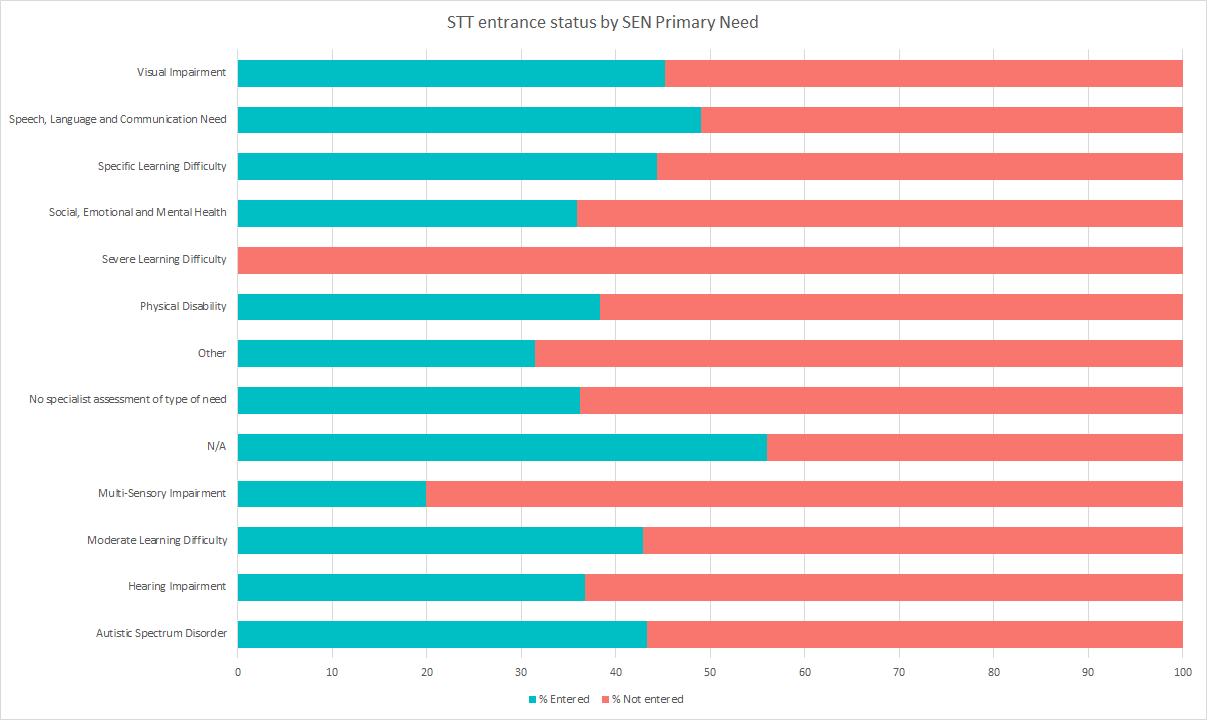
Entry for the Secondary Transfer Test (Bucks 11-plus) by SEN need
Entrance rates by socio-economic status.
The study also looks at entrance rates based on the Income Deprivation Affecting Children Index (IDACI).
This data shows that 19% of children in most deprived areas of Bucks decide not to sit the 11-plus while in the wealthiest areas of Bucks only 10% of pupils skip the test. The numbers of children in IDACI decile 2 are, however, small. However this is yet another way of proving that the poorest families withdraw their children from the test process, which fits with a pattern of low pass results for low income families.
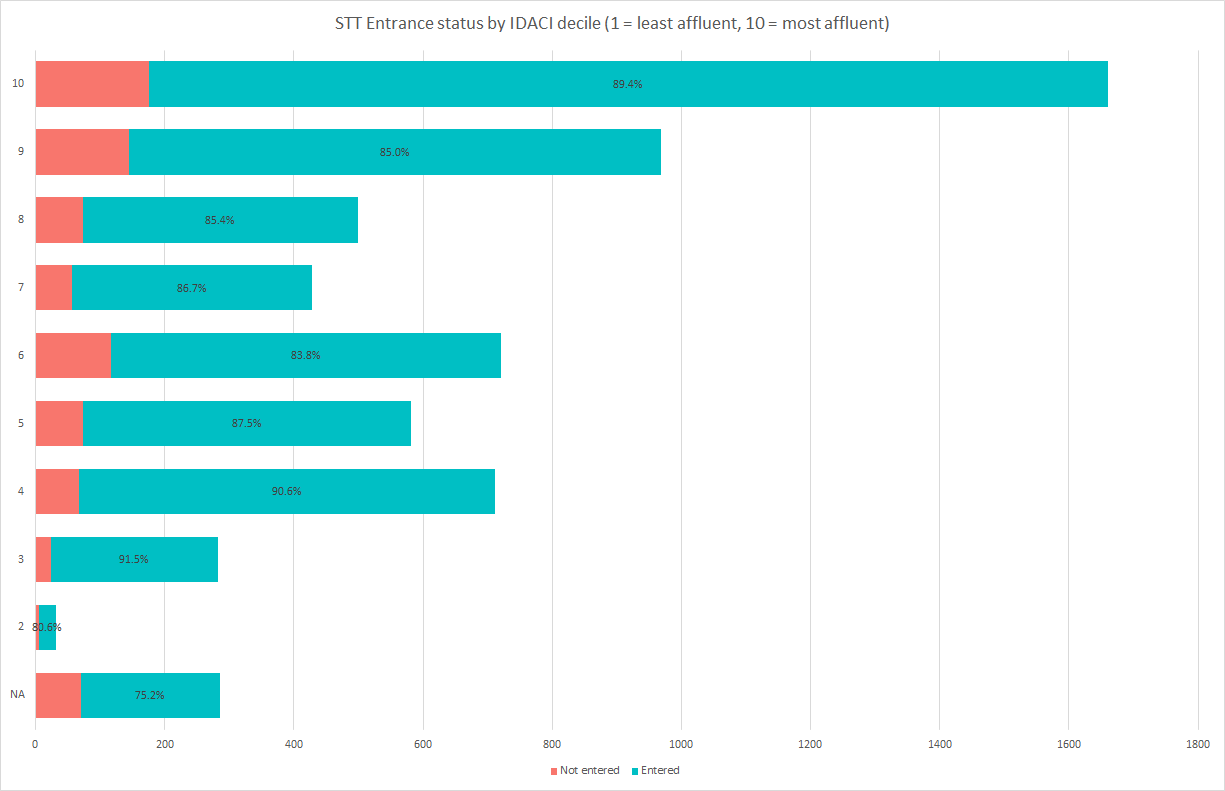
Withdrawal/entry in the STT (Bucks 11-plus) by wealth of home area
One interesting finding from this study is that children in the 3 and 4 IDACI percentiles are more likely than average to enter the test. In these IDACI deciles the pupils are almost as likely as children in the wealthiest IDACI percentiles to sit the test.
We’ve seen that pass rates are lower for children in these low income groups, but their parents still want them to try the test. Maybe aspirational factors account for this? Grammar school might be seen as the best hope of a good education, even for children unlikely to ever get into them. The fact is that children in these lower income groups will sit the test but be more likely to fail, and no one studies what this result at 10 years old does to a pupil’s motivation.
The TBGS summary of who takes the test, and who does not, is as follows.
11-plus entrants are more likely to be:
- From an ethnic minority group.
- Be an EAL pupil.
- Come from the extreme IDACI deciles (2-5 and 9-10).
- Have higher KS1 & KS2 attainment.
11-plus entrants are less likely to be:
- SEN pupils.
- Eligible for FSM.
Conclusion
The report concludes that, ‘the 11-plus displays, ‘no evidence of function in a markedly different manner to KS2 SATS… No changes are recommended currently on the basis of this report’s findings.’
The Bucks Grammar Schools say that because their test’s low rates for certain demographic groups reflects these groups performance in SATs, their test is not a problem. However there is a huge difference between certain pupil groups achieving lower scores in SATs, and certain pupil groups achieving lower scores in the 11-plus. SATs tests are not used to judge pupils only schools, they have no impact on a child’s educational opportunities. But Bucks 11-plus tests deny high status, highly rated, schooling to pupils at secondary level.
The Bucks grammars suggest ‘there is nothing to see here,’ but what there is to see is educators knowingly denying schooling to specific demographic groups of pupils, and not appearing to give a fig about it.
It seems to be widely accepted that grammar schools are different, that this is just the way things have to be. But as study after study proves categorically that poor children, SEN children, and certain ethnic groups are statistically less likely to access grammar schools, the question has to be asked, is this a system with enough benefits to outweigh this social inequality? If grammar schools really are ‘better’ schools then why are we creating a system where better schools are being accessed by more advantaged pupil groups? If they are not ‘better’ schools, then why are we clustering advantaged pupils together mostly to please wealthier parents? It’s clear that in many cases grammar school places are taken up by parents keen to save private school fees. The most needy pupils are shown again and again to be locked out of grammar schools. This research is nothing new, but it is notable because it is the grammar schools themselves proving the flaws of their test.