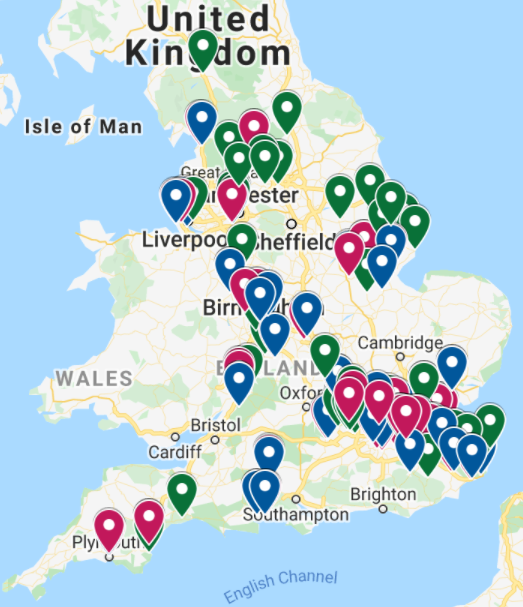
Comprehensive Future has produced an interactive map of every grammar school in England. For the first time ever, hard-to-access facts about individual selective schools and their pupil population are available to everyone. Information such as the percentage of pupils on Free School Meals compared to non-selective schools in the same area, the proportion of out-of-area pupils and of pupils who attended a fee-paying ‘prep’ school is now available at the click of a mouse.
The map shows that on average only 5% of grammar school pupils are on free school meals. In non-selective schools the average is over four times that figure at 23%. The map also reveals that several grammar schools educate a quarter or more pupils who come from the private sector. The highest proportion of privately educated pupils to access a grammar school is found in a Kent selective school where some 60% of its pupils attended a fee-paying ‘prep’ school before taking up a state-funded grammar school place.
Comprehensive Future’s chair, Dr Nuala Burgess said, “This map confirms a growing body of evidence which shows that grammar school places are monopolised by the privileged. The idea that grammar schools can be part of any kind of ‘levelling up’ agenda is a nonsense. Put simply: our interactive map proves that you have a far better chance of getting into a grammar school if you are not on free school meals and if you come from a private school. The map is a brilliant way for people to see for themselves the huge educational injustices that exist not only in selective areas but also in areas where the impact of one or more grammar schools skews the results of every local school.”
“We understand that there are many very good grammar schools. This map is not designed as an attack on individual schools. Our aim is only to share factual information about selective education so that people can see for themselves how deeply unfair it is.
“We really hope that parents in selective counties such as Kent and Buckinghamshire will take time to look at our interactive map. We want to help people understand the many different, and often hidden ways academic selection reverberates on every school in the local area. When people see the impact of grammar schools on the schools which surround them perhaps they will understand why Comprehensive Future feels so strongly that selection is wrong and the 11-plus must be phased out.”
Comprehensive Future’s interactive map also reveals discrepancies in the pass marks of different 11-plus tests. Some grammar schools set an entrance test designed to be passed by children who have scored highly in their SATs while others set easier tests passed by pupils with average SATs scores.
Dr Nuala Burgess said, “Our map shows the enormous variety in 11-plus tests. Selective schools with the ‘best’ results are simply setting harder exams tests designed to weed out 10 year-olds deemed less likely to achieve top GCSE and A levels. There is no ‘grammar school standard’. It’s a myth. Comprehensive Future’s interactive map will show everyone how these schools are engineering their results.”
The I newspaper featured CF’s map project in an article on March 16th. Read HERE.
The Comprehensive Future grammar school map can be found HERE.
Comprehensive Future has also produced written guides to the 35 local authorities that contain selective schools. The guides detail local issues with 11-plus testing, results, and specific problems in each selective area. CF hope this information will inform citizens in selective areas and encourage campaigning. You can find the guides HERE.