
By James Coombs
In 2018, the Times Education Supplement published an article, Grammar heads wanted admissions that would illegally favour local pupils. A couple of years later the underlying events cropped up in court proceedings. These did not address the question of legality but did unearth a whole lot of evidence revealing the very non-standard way 11-plus tests were being “standardised” behind the scenes.
Standard standardisation.
Standardised testing is a simple concept. i) Test everyone, ii) Work out the mean and standard deviation values, iii) Use these values to show where each individual candidate sits on the ubiquitous bell-curve relative to everyone else. This is measured in standard deviations (σ) relative to the mean (μ) and typically range between ±2.5σ. That includes negative scores and decimal fractions so, by convention, these “z-scores” are rescaled so the mean μ=100 and each standard deviation σ=15 (Wiliam 2001). See the above illustration before the animation starts. The first axis shows z-scores. The second shows the equivalent standardised test scores.
Non-standard standardisation
The documents disclosed in court show that in 2013 Buckinghamshire’s grammar schools were concerned that insufficient candidates were passing their test. The pass mark is 121 but changing this would require public consultation so the grammars asked their test provider to recommend “alternative approaches”. The test provider suggested keeping the mean μ=100 but increasing standard deviation to σ=90. The above animation demonstrates that the proportion of those “passing” the test increases until it is over 40%.
The test provider was also given access to candidates’ personal data, including whether they live inside or outside the county, their ethnicity, gender and primary school attended. Using this information, they suggested increasing the weighting of the Verbal Reasoning test would move 88 places from ‘out of county’ candidates to ‘in county’ and even discussed how they could modify the gender balance of the candidates that qualified.
The grammar schools instructed their test provider to ensure the test was “standardised” in such a way to ensure that 1,600 ‘in county’ candidates taking the test obtained the qualifying score of 121.
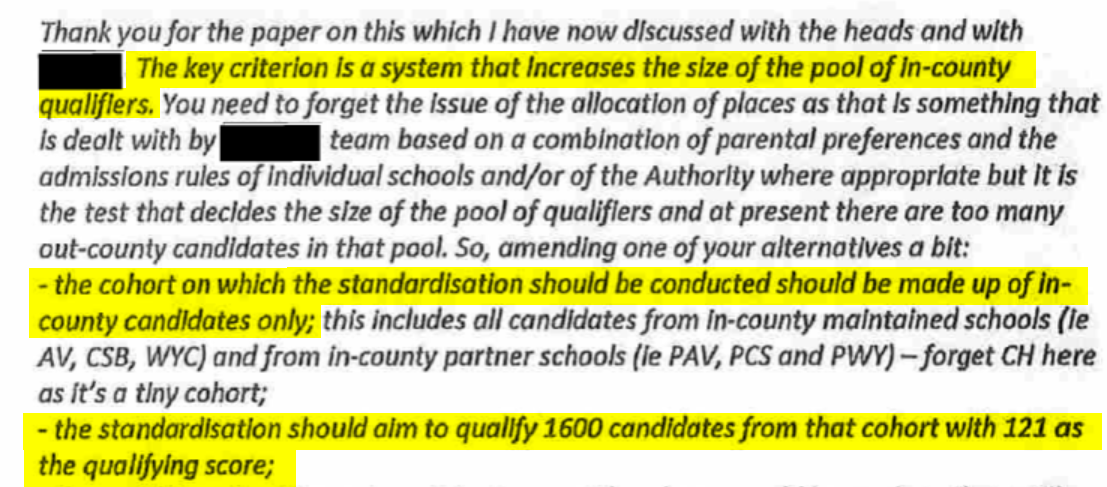
Excerpt from email January 2014 discussing “alternate standardisation”
The clearest way to lower the test score is to lower the test score! This gives neighbouring schools an opportunity to question this. In 2018, two of the county’s grammar schools received funding to expand. The DfE repeatedly refused to disclose how much taxpayer money was spent on this although the local press reported that John Hampden Grammar School’s share was £3 million. At 38.6%, Buckinghamshire has the highest proportion of children studying in grammar schools (DfE Data n.d.) in the country. Several sources have warned about the damage this causes to neighbouring schools (Spens et al. 1938; Gewirtz, Ball, and Bowe 1995; Andrews, Hutchison, and Johnes 2016; Allen 2016a, 2016b).
Rubber standardisation
Commercial test providers have claimed in court, with diminishing success, that the way they standardise 11-plus tests is their “intellectual property“. To understand how this works, imagine the scores are plotted on the usual bell curve the but scale along the bottom is written on rubber. This can be stretched or shrunk (changing the standard deviation). It can be shifted left and right (changing the mean). This means no matter how candidates actually perform in the test, the results can be “standardised” after the event to guarantee the required number of them “pass” for the selective schools fill all their places with a few spares on the waiting lists. Laying commercial claim to basic arithmetic functions (+, -, ×, ÷) seems a bit of a stretch, but I want it on record that I came up with the superlative marketing drivel Rubber Standardisation[TM] to describe this practice.
Maths animations
Animation was made using the Python Manim (Mathematical Animation) library, created by the extraordinarily talented Mathematical YouTuber @3Blue1Brown (aka Grant Sanderson). Check out his video on why to apply logarithms to Escher’s drawings. Code used to create the illustration above is on github https://github.com/jamescoombs3/rubber-standards.
References
Allen, Rebecca. 2016a. ‘Grammar Schools Contaminate Comprehensive Schooling Areas’. FFT Education Datalab. https://ffteducationdatalab.org.uk/2016/08/grammar-schools-contaminate-comprehensive-schooling-areas/ (February 15, 2026).
Allen, Rebecca. 2016b. ‘Inequalities in Access to Teachers in Selective Schooling Areas’. FFT Education Datalab. https://ffteducationdatalab.org.uk/2016/06/inequalities-in-access-to-teachers-in-selective-schooling-areas/ (February 15, 2026).
Andrews, Jon, Jo Hutchison, and Rebecca Johnes. 2016. Grammar Schools and Social Mobility. Education Policy Institute. https://epi.org.uk/wp-content/uploads/2018/01/Grammar-schools-and-social-mobility_.pdf (February 14, 2026).
DfE Data. ‘Schools, Pupils and Their Characteristics’. Department for Education (DfE) website. https://explore-education-statistics.service.gov.uk/find-statistics/school-pupils-and-their-characteristics/2024-25 (February 15, 2026).
Gewirtz, Sharon, Stephen J. Ball, and Richard Bowe. 1995. Markets, Choice and Equity in Education. Buckingham: Open University Press.
Spens, Will, Dorothy Brock, Lynda Grier, Percy Jackson, Joseph Jones, Hugh Lyon, Shena Dorothy Simon, et al. 1938. Board of Education Report of The Consultative Committee on Secondary Education with Special Reference to Grammar Schools and Technical High Schools.
Wiliam, Dylan. 2001. ‘Reliability, Validity, and All That Jazz’. Education 3-13 29(3): 17–21. doi:10.1080/03004270185200311.